Happy #MapInfoMonday!
In this MapInfo Monday post, I want to show you, how to create parcels, pedestrian sidewalks, road pavement areas due to a new dam construction, a town needed to move to a new area.
In this post, we will create an easy and fast planning draft, starting from road centerlines.
Thanks to Peter Møller for this opportunity.

1.Project boundary and existing highways
We will use existing highways and project boundary for re-settlement.

First we need to draw road centerlines and populate the road buffer width. If the road width will be 10 meters, we need to enter 5, because buffer will be created in both sides of the roads.
Below we have drawn a draft road centerlines, and entered the road buffer widths in meters.

The road width column contains the buffer with for one side of the road and should have 0 values.

2.Create buffer for road pavement surface based on road centerline width.
Choose Buffer èBuffer Table menu from the Spatial tab and Select Road Centerlines table as input and “New” for output table.


Click Next, and Choose Add To Current Mapper to add the results into existing map window

Click Next until the Buffer Objects dialog shown.
Then choose Radius: From Column and choose the column where the width of the road stored.

For Data Aggregation, we can leave blank or choose No Data option, since we don't need any information in the new buffer table.

We will name the layer as Road_PavementArea or you can give any proper name.

Below is the result buffer area displayed in orange.

3.Create plot areas by using enclose function:
Make the Road Centerlines layer editable, if not editable,
Copy and paste Project_Boundary object into road_centerlines layer and convert it to polyline from Spatial è Convert è Convert to Polylines.

Then Create a new table and name it LandUse_area, with 2 columns Land_use character 20 and Area Decimal (20,2)

Select all Road_centerlines, (by right clicking from the Explorer window, and choose Select All)

Choose Area è Enclose from Spatial Tab, this will create polygon inside the road centerlines and project boundary.

4.Erase overlapping areas
To erase overlapping polygon areas from road pavement surface, select all polygons, Choose Set Target from Spatial tab.

Select all Road pavement objects.

and choose Erase è Erase Objects menu from Spatial tab.

The result objects will be like below

5.Create pedestrian sidewalk buffers for roads.
We will create sidewalk areas from polygons that are left after erasing in step 4, to do this first select Buffer è Buffer Table menu from Spatial tab,

Choose LandUse_Areas for buffer from table and <New> for store result table.

Set the sidewalk width from Radius: Value, such as 1 or 2 meter(s), and chose One Buffer for each object from the dialog below:

We can leave the data columns as Value or Blank

To calculate the Sidewalk Perimeter, we can add new column, by clicking Table è Modify Structure from the Table Tab

Choose Sidewalk_Areas, and click Add Field from the following dialog, Type Perimeter_m, Column type Decimal (20,2)

To calculate perimeter of the pedestrian sidewalks, click Table è Update Column from Table tab

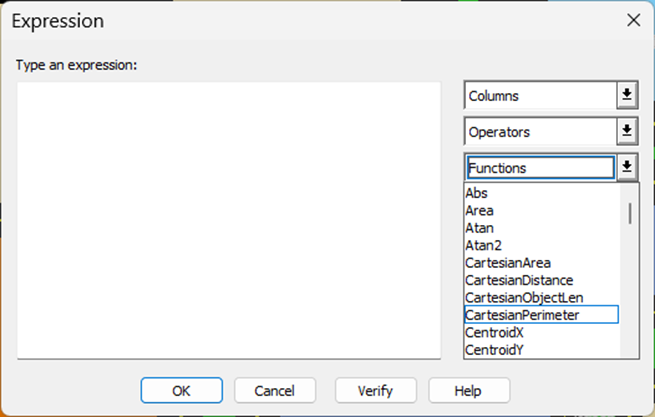
Choose Table To Update, Column to Update as below, and press Assist button.

From Functions Dowp down list, choose Perimeter, CartesianPerimeter or SphericalPerimeter , and then click OK
Click OK to calculate and close the dialog,

Then we should erase sidewalk areas by LandUse_Areas same as in step 4, to calculate the pedestrian sidewalk area properly.
(Set Sidewalk layer editable, select all Sidewalk objects, Choose Set Target from Spatial tab, Select all LandUse Areas and click Erase è Erase Target )
Then we can change the display colors of the layers as below to see the results clearly.

6.Calculate areas & perimeters
For Land use parcels:
We can update Areas of each polygon by using Update Column button from Table tab. Choose Landuse_Areas table and Area column, and type or choose Area from Functions dropdown list:

For sidewalks, repeat the above process for table Sidewalk_Areas to calculate the areas.
7.Land Use Types
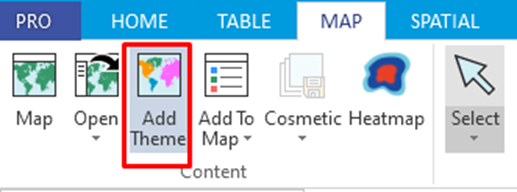
Enter land use types for each parcel, such as, Green, Educational, Sports, Residential, Health, Commercial etc. Create Thematic map by clicking Add Theme from the Map tab.
Choose Individual type and
Choose Table name and Field as below

The colors can be left as default (left) or can be modified from Styles button now or later (right)


The result will be like below

8.Calculate statistics for land usages:
By using SQL Select dialog from Table tab we can calculate and display the Land Use types, areas and percentages.
By using SQL Select or double clicking on the project boundary object, we can learn the area of our Project boundary.

in our case the area of the project boundary is 1,659,561.07 sq m.

In SQL Select Type:
Select : Land_USE, Sum(Area(Obj,”sq m”)) “Land_Use_Area”, Sum(Area(Obj,”sq m”)/ 1659561.07 *100) “Land_Use_PErcentage”
From: LandUse_Area
Group By: Land_USE
Order By: Land_USE
Into Table Land_use_Stats

The result will be like below

We can calulate the road surface area as below

the result will be like below:

For pedestrian Sidewalks

We can create a new table to store these statistic values in one table and append the results into that table. Alternatively We can Save copy of the Land Use Stats as a new table also ( Save è Save Copy As from Table Tab)

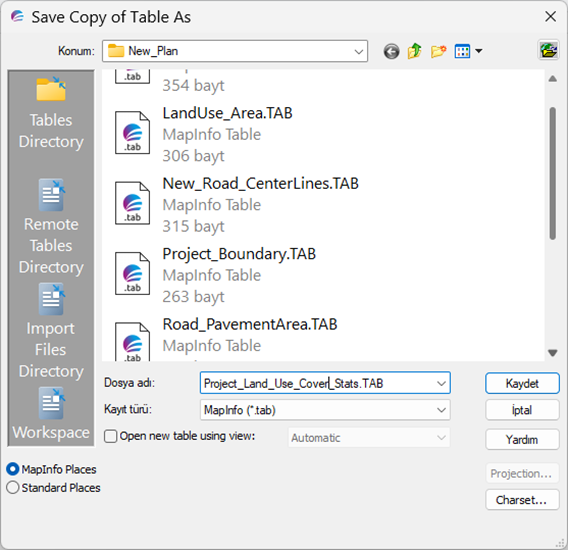
Open the saved table from Open è Recent Files from Table tab

To combine statistics, we need to use Append Rows from Table tab

Append Road_stats, SidewalkStats and Project Area statistics to the Project_land_Use_Cover_Stats table one by one as follows:


The Project Area Land Use Percentage, we can change it to 100 per cent.

9. Building footprint limit
To create limiting border for building footprints from the edge of the parcels we can create a new buffer from table

In the buffer object dialog choose From Column and From dropdown list choose Expression
Select Road_width column and type + 5 in the Expression box

We have the limiting border in dashed lines

The footprint limit and sidewalk width can also be stored in road centerlines for non unique values.
10.Labeling and Print Layout
We can change the layer displays and can have a better visualization like below,:

To show each land use type and area, [1] Click LandUse_area Layer’s label box,
[2] Select Expression from Label Using list, and type Road_Width + Chr$(10) + “(“ +Area + “ m2)”
[3] Choose Center obj object as position of label
[4] Choose Allow Dublicates and Label Partial Objest (to show the label in visible part of the objects if the center of object is outside)
[5]Choose Halo for better readability
Now we can create a layout window to store map and statistics.

We can choose blank or any ready to use template, like Simple Landscape with map and browser.
For Blank Template, add the prepared map to the page from MapèMaps: Sidewalk… from Layout tab.


Then add Project_land_use_Cover_Stats ( if not open, press F4 and open it) browser from Browsersè list of Layout tab.
You can add Title, North Arrow, Legend, Company Logo etc by using Layout tab.

To add Coordinates, run Graticule.mbx ( If you don’t have, you can download from https://georezo.net/jparis/ppcc/moregratic.htm) and Add Graticule by right clicking on the map. In layout first double click to activate map and right click).
Note: I've started as a part time lecturer and this post is based on the Final Project of Undergradute Students of GIS course in City planning department. Although it was a remote class due to the massive earthquake in the south of Türkiye, they all submitted successfully.
------------------------------
Ahmet DABANLI (Ph.D)
Başarsoft/Mapbis
Co-Founder
------------------------------