A digital elevation model (DEM) is a digital representation of the ground surface and is typically used to represent the bare-earth terrain void of vegetation and man made features. By interpolating known elevation data from sources such as ground surveys, satellite and photogrammetric data capture a digital elevation model grid can be created. The Shuttle Radar Topography Mission (SRTM) data were used to generate digital elevation data globally. Free Dems can be downloaded from the United States Geological Survey (USGS) website.
When rendering DEMS there are 2 important things to keep in mind:
- The colour ramp
- The colour transformation method.
Dems can be coloured in different ways which makes visual interpretations easier. A common way to render elevation data is by using the green, brown, white colour elevation ramp. For example a common rendering technique is called Hypsometric tinting whereby deep greens are used for valley bottoms and as one travels up-slope the colour changes from browns to creams and white on mountain tops.
When you open a Dem in MapInfo Pro by default it is displayed in Pseudocolour, this is a stretched display using a histogram equalize algorithm. The Dem in this example has a resolution of 30 m and represents an area in the North west of Sulawesi, Indonesia.
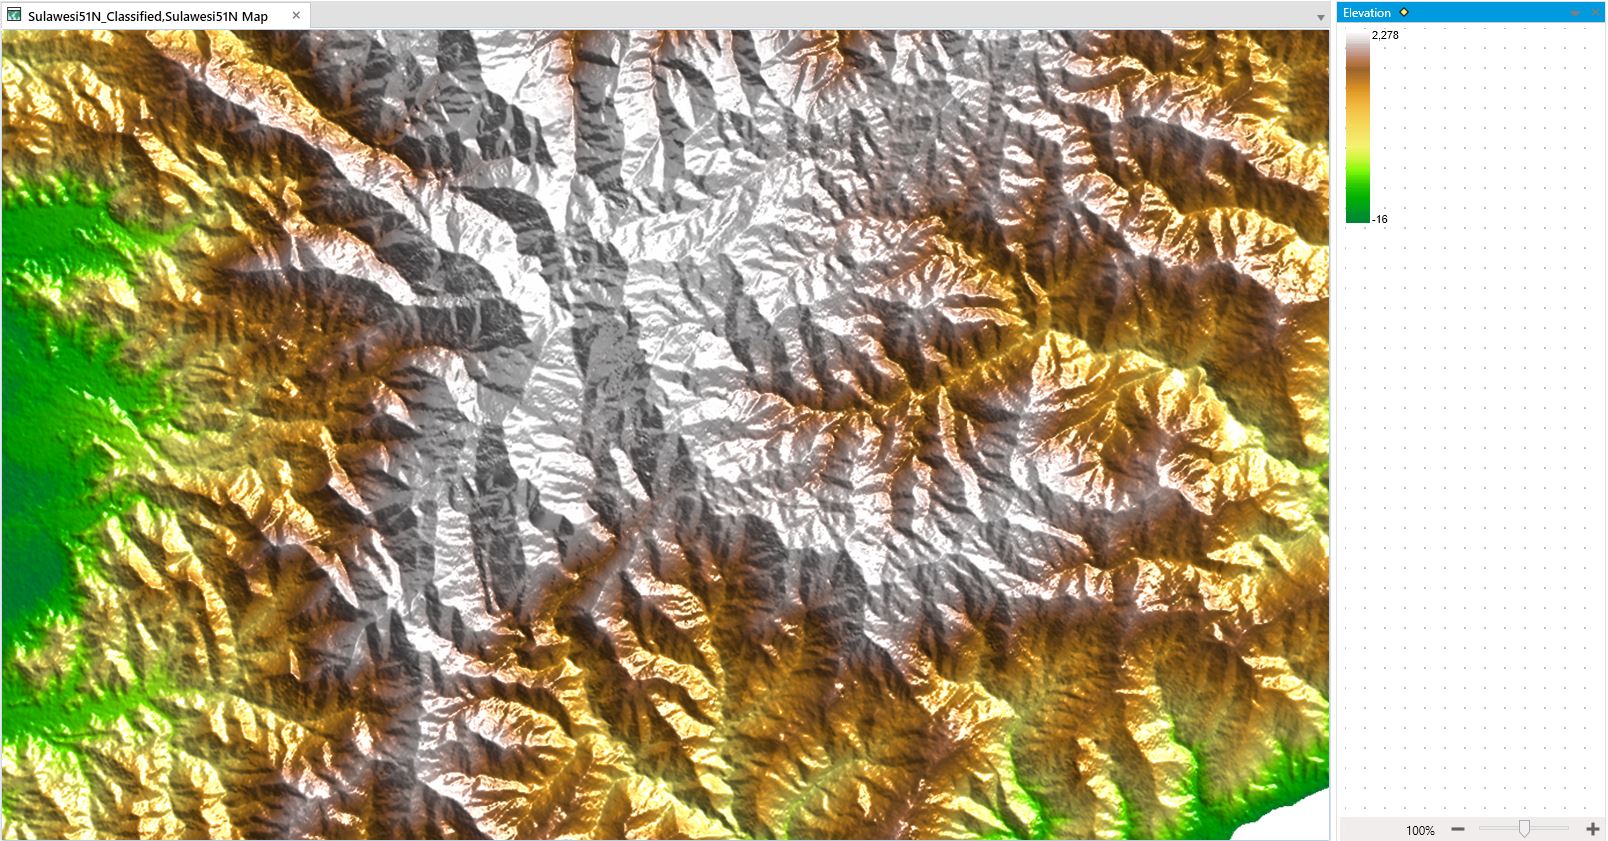
A stretched display when used along with hillshading helps in seeing the relief very well. The hill shade tool in MapInfo Pro can be used to mimic the sun's effects like illumination, intensity, shadows on DEMs. A hillshade is a grayscale 3D representation of the surface, with the sun's relative position taken into account for shading the image. This function uses the altitude and azimuth properties to specify the sun's position
A few of the classification methods include natural breaks, equal interval, defined interval, quantile, and standard deviation. The human eye is tuned to search for meaning in colours, one way to exclude bias when analyzing the surface is to change it to grey scale and use equal intervals, but a grey scale Dem might not look very appealing.
For the same area I have applied 4 different kinds of transforms, so visually which map is more correct or is any one telling "white lies"?
It is easy for the human eye to be tricked by the abrupt change in colour used in stretched rendering and therefore classified methods of rendering like equal interval or defined interval gives the user more control in defining the colour for various elevation intervals.
The Dem below depicts the equal interval method with hillshading, so how does this compare with the above methods of transform?
There is no right and wrong colour transformation method, if you know the geography of your area and what characteristic of the topography you want to communicate in the map then it is better to use an equal interval method or a user defined classification. The color stretch tool in MapInfo Pro has various transform methods to render a raster including a digital elevation model .
I hope this short note would be useful for anyone who wants to get started with Digital Elevation Models.
Go on then! download free Digital Elevation Models and use MapInfo Pro to render them.
Have fun!
------------------------------
Susan Bardet
Software Support Engineer
susan.bardet@pb.comPitney Bowes
Henley-on-Thames
RG9 6AB Oxfordshire
pitneybowes.com
------------------------------